|
The Tartini-R Polygraph
What is this?
This is a free software system developed by Terry McGee and Graeme Roxburgh
to analyse pitch information for an instrument like a flute. You can record yourself or someone else playing tunes on a flute, (or use a
pre-recorded file)
then look at the distribution of pitch for each note of the scale.
It uses a free program "Tartini", and another free program "R"
plus an R script to produce a graph like this:
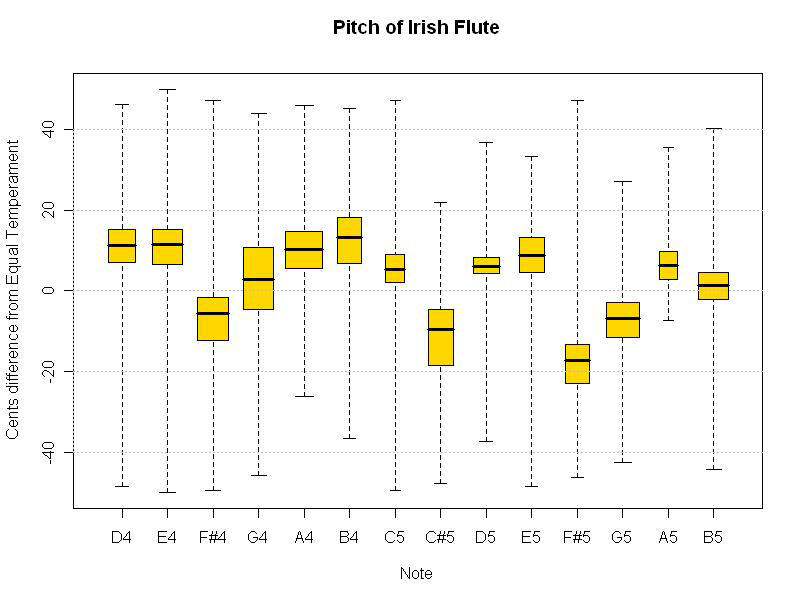
This particular plot is from Graeme playing tunes on a mid-19th century Siccama keyed flute made by Metzler. The plot is shown comparing pitch
to equal temperament but could just have easily been plotted against Just
Intonation in D or any other temperament we want. The most important part of
the graph is the thick horizontal line showing median pitch for each note. The yellow box shows upper and lower quartiles and so the boxes contain half the data.
A warning
While this software seems to be capable of producing an accurate picture of what's happening, it is very easy to misinterpret what it is telling you.
Plus of course there are limitations. Sometimes Tartini will report a note in the wrong octave particularly when really pushing the flute with a very reedy tone.
And of course that's the very way you might be playing the flute. Check the actual plot inside Tartini to see if this is a major issue. It
shouldn't
matter too much anyway unless the octaves are badly out of tune.
So please don't jump to conclusions. Run a number of tests first to
make sure what you are seeing is realistic.
And please, do not publish the results it produces of a living maker's flute or
a living player's performance without their permission, unless you can do so
without any risk whatsoever of their identification.
Graeme can be contacted at: groxburgh@infoscience.otago.ac.nz
Download
Download the software and read how to set it up here.
Last updated, 17 April 2008. |