Flute Tone Investigations 2Analysing an existing recordingIntroductionIt's never a bad idea, when embarking into uncharted territory, to run a little trial first. Get the lie of the land before getting too deep in mud. We want to find ways to measure and characterise flute tone, and we want the process to be realistic, so let's take an existing flute recording and see if we can dissect it. At least we should learn something from trying! So what's our tune? It has to be solo flute, it has to be freely available for everyone to listen to, it would be handy if it were reasonably slow so we have time to appreciate the tone colour, and time to measure it. And it would be nice if we liked the sound of it. Not that that's essential - we are going to need to investigate sounds we don't like too, if we are going to be able to characterise the difference. But hey, let's not scare listeners off just yet! I think I have a good candidate. It occurred to me when I was putting together the page on the late Paul Davies that his Lament of the Three Maries was a particularly lovely air, and well played with a powerful reedy tone. I'm sure Paul, flute player and restorer, wouldn't mind "helping authorities further with their enquiries". You might like to listen to it now and see if you agree. In fact you should listen to it before proceeding or while proceeding. Fast Fourier TransformFirst step then is to take the tune and run it, note by note, through Fast Fourier Analysis. Eh, what? In case you were asleep the day they ran through FFT in university Physics, it's simply a mathematical process for de-constructing waveforms into their harmonic components. These days FFT exists as convenient software - I used the "Plot Spectrum" feature of the free Digital Audio Editor software package Audacity to carry out the FFT on the Maries. Since you can download Audacity and the tune, you can do it yourself if you want to check my results. Cool, eh? Here's what an FFT looks like. (This one is actually me playing the note A in the low octave.) At mid screen, you can see a narrow peak representing the fundamental of the note at 440Hz, coming up to a level of about 18dB below full scale. To the right of that, is the second harmonic (at 440 x 2 = 880Hz), somewhat higher in level at just over -12dB. Visible further to the right are the peaks representing the third, fourth, fifth, sixth and seventh harmonics, reducing in level down to between -36 and -59dB. At the bottom of screen you can see the noise floor, extending from around -64dB in the bass to about -77dB in the treble. As long as the noise floor is well below the tips of the peaks, it doesn't concern us.
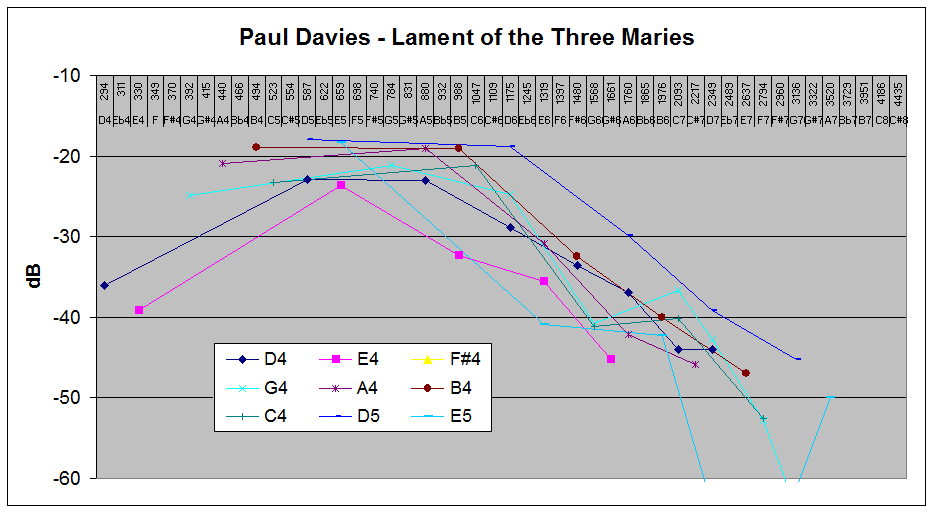
A challenge for us with this traditional appearance of FFT is that it is not friendly to comparison. Superimpose another FFT of another instrument or player over this one, and it becomes hard to see one for the other. So our first issue is to find a more comparison-friendly way to present the data. Response vs frequencyHere's my first effort, displaying the response of the various harmonics versus their frequency, just as the FFT does, but "joining the dots" from peak to peak so we can afford to illustrate all the notes and all their harmonics on one graph. This one is Paul:
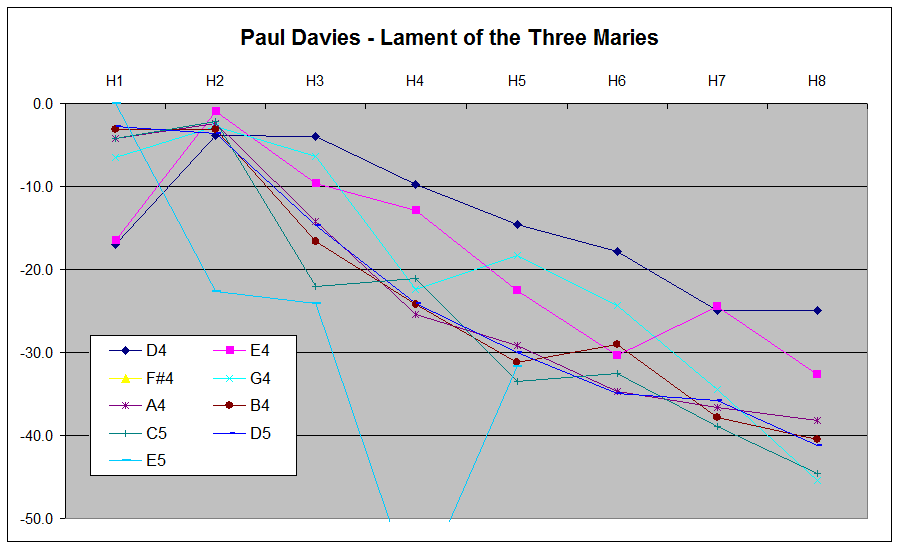
D4's second harmonic is D5, much stronger at around -23dB. Third harmonic is A5, also about -23dB. From then on upwards, the harmonics are loosing strength - D6 comes in at about -29, F#6 at -34dB, A6 at -36dB and so on. You can follow the ups and downs of the various harmonics of all the other notes in the same way. You'll notice the conspicuous absence of yellow - the Maries uses a gapped scale - there are no F sharps. I faced a dilemma in choosing the horizontal axis - frequency in Hertz, or note values? So I included both. Now, what do we learn? A few interesting things .... Firstly, with the exception of the bright blue D5, all the harmonics are starting to lose energy from around A5. We can say Paul's flute has a cut-off frequency around 880Hz. Cut-off frequency may prove to be one of the parameters we will need to consider. It's the frequency above which the flute is no longer supporting the resonance. Secondly, notes around the bottom of the tube (D4, E4 and E5) had an even lower cut-off, while D5 had a higher cut-off. Interesting! Thirdly, the slope of the attenuation above cut-off seems reasonably constant at around 15dB per octave. Finally, it all looks a bit like spaghetti junction, doesn't it. No strong, clear correlations. We might want to look for a more meaningful presentation format. Harmonic View?Supposing, instead of presenting the responses of the various harmonics against their frequencies, or their note values, we organise them by their harmonic number? So that all the fundamentals are in column 1, all the second harmonics in column 2 etc. And instead of putting up with the fact that the various notes come in at various levels, we correct that also, so we can compare like with like ....
Ah, now that has a bit more form. Note that A4, B4, C5 and D5 are forming a reasonable cluster. So why do the others differ? Let's take them one by one.
I guess it become clear from this format that there is unlikely to be a single note that conveniently represents the tone of all the notes on the simple system flute. We knew that from our own experience, didn't we, but comforting to have it confirmed. So we should certainly run into trouble if we tried to compare the tone of B on one flute with that of F# on another. But we could reasonably pick a note and stick with it, at least as a starting point. One from the cluster would seem logical, and A is probably as good as any. Or perhaps we should pick two - say D to represent the well-vented but narrow bottom end, and A to represent the wider but poorly vented left hand notes? Seem like a plan? Um, haven't we forgotten something?Oops, yes, that second octave. The Lament of the Three Maries is perhaps not the place to enquire into the second octave, having only D5 and E5 to boast of. D5 had taken refuge in the cluster, so we can temporarily forget about it. (I say temporarily, as perhaps it won't take refuge in the cluster on other flutes, or with other players. We are going to have to be careful not to lose sight of all the players as we turn our attention to different games.) But E5 stands out. A massive 23dB drop to the 2nd harmonic and a few more to the 3rd - E5 is basically represented by its fundamental alone. Certainly, we're aware that 2nd octave notes sound more "flutey" than low octave notes which can be played with a range of tone colours from flutey to reedy. And why are the harmonics weak? Go back to the first graph and you'll see that the second harmonic of E5 (which is E6) is above the cut-off frequency, about 1KHz or the note B5. The flute can deal efficiently with E5, but is giving up on its harmonics. We won't give up on them for now, but, in our initial investigations, it will pay us to concentrate on areas where we can expect to see more action. At least until we've developed and honed our tools a bit. Now, I don't know about you, but all this talk of various harmonics at various levels doesn't mean much to me on an instinctive level. Are there ways we can re-organise this information further to make it correspond to our own perceptions? Yes, I believe there are, but we do have to be honest - we're going out on a limb here. But that's perhaps the only way to find out if it will take our weight! Let's look at some of the words we often resort to in describing sounds and see if we can link them to aspects of our data. BodyI routinely use this term to describe the underlying base of the note, upon which other properties like reediness, warmth, brightness, darkness, etc perch. I suspect it's closely linked with the level of fundamental (H1). It seems to me that big bore flutes like the Prattens and the Boehm have more of it, and small bore flutes like the Grey Larsen Preferred (GLP) have less of it. I'll get to test my perception (gulp!). So, as a first approximation, let's assign the level of fundamental to Body. I'm perfectly happy to consider other possible names! ReedinessThe famous 19th century player Nicholson said:
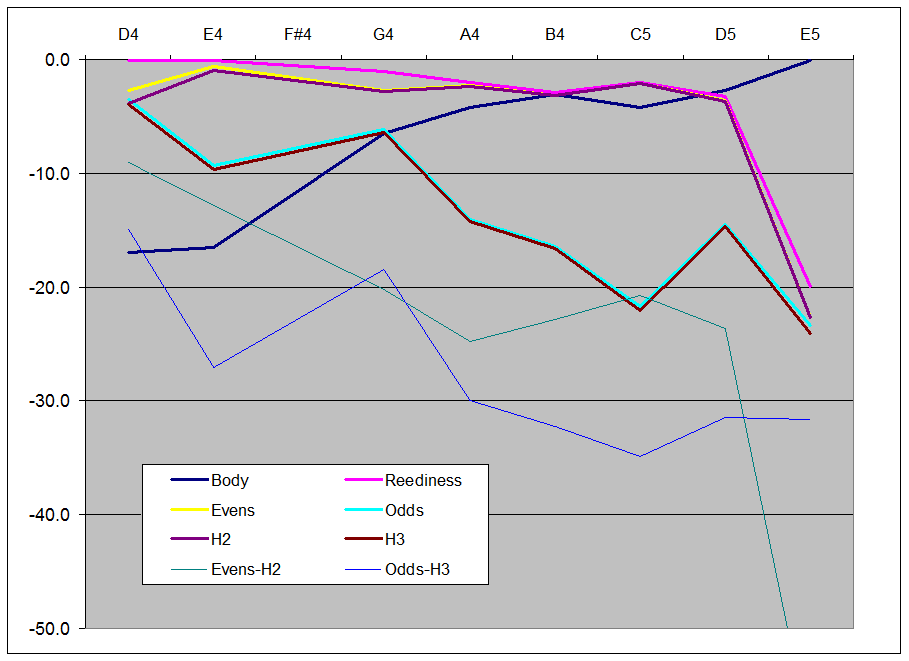
So what is reediness? How about this for an interim definition? (Until our investigations suggest otherwise.) Reediness is what's left when you take out the Body. It's the sum of all the energy tied up in the harmonics. Hmmm, bold! But perhaps we wouldn't be happy just splitting our flute in two - "Body" and "The Rest". So what else could there be? WarmthSome of us embraced the Digital Sound Age with both ears. Clarity at last! Others actually found they missed the mud, and they can be found reviving old tube amplifiers (or building new ones) to recover it. Are they insane? Does it have any possible relevance to flutes? While large amounts of distortion (think guitar fuzz-box) are pretty ghastly, a little bit of some distortions are actually warm and friendly. HiFi researchers discovered that small amounts (a few percent, or in dB terms, say -30dB) of even order harmonics can give a stark recording a pleasant degree of warmth. What are "even-order" harmonics, and how could tube amplifiers and flutes generate them? Even order harmonics are simply those with an even number - in our case H2, H4, H6 etc. They are generated when a vibrating system suffers a non-linearity - something that favours the negative or positive excursion over the other. The perfect sinusoidal trace becomes a little top or bottom heavy. Amplifying tubes do this by progressively running out of emission at one end of the signal excursion - most of the available electrons emanating from the cathode have been attracted to the anode and so it becomes harder and harder to attract more. Flutes do it when we don't aim directly at the "edge", but aim above or below (usually below). The jet has to wander much further in one half cycle than the other, causing even harmonic content. The further we direct the jet away from the edge, the more even-harmonic content (I won't call it distortion any more, promise!) we get. If you're interested in how this was employed historically on the flute, see John Gunn on Tone. So, yes, we definitely want to be advised of even order harmonics, don't we. EdginessHiFi researchers attribute edginess to the odd-order harmonics, and in particular H7, which is actally out-and-out dissonant (the seventh harmonic of D4 is C7 - play D and C together yetch!) So we'd want to keep an eye on our odd-order harmonics, wouldn't we. And there are other classic perceptions we might want to monitor, such as brightness, darkness and presence, but I suspect we have enough to make a start on. Some serious number crunchingUnfortunately, our FFT results, expressed in dB, cannot be simply added or subtracted, divided or multipled. They need to be converted back into an energy measurement, and even then, manipulated as root sum of squares. Further than that we are going to have to come up with a protocol for expressing our findings. Here's what I'm proposing, but I'm open to debate: We calculate the total energy represented by all the harmonics (including the fundamental) of each note. We then express any parameter we are interested (such as reediness, the sum of all the harmonics other than the fundamental) as a proportion of the total energy. Because we want the results in a measurement system that reflects human sound perception, we drop it back into dB. Seem like a plan? Paul unmasked!The table below reveals what we found. The 0.0dB line across the top represents the total energy in each of the notes. The various coloured lines show how that energy is spread around. I'll remind you that a 3dB change is just noticeable under normal circumstances, a 10dB change is perceived as doubling. So a 20dB change is two doublings, or a quarter; and 30dB three doublings, or an eighth; 40dB a sixteenth and so on. The navy blue is our "Body" - the energy in the fundamental of each note. You'll see it starts at around -17dB for low D, gradually becoming a greater proportion, and by the time it gets into second octave E5, it's pretty much the lot! Reediness (all the harmonics bar the fundamental, in pink) is big! It's the most significant sound in the whole bottom octave. When we go on to analyse it into Odds and Evens, we find that it mostly comprises Even order harmonics (Yellow), and when we break that down further, we find most of it is 2nd Harmonic (purple). It's then a big step down to the odd harmonics' contribution in green, which also turns out to be largely the third harmonic (in brown). The contributions of even and odd harmonics other than H2 and H3 are shown in the thin green and blue lines, way down in the mix.
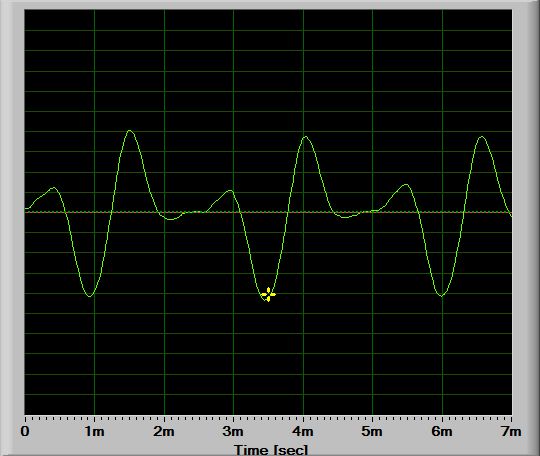
The big onesIn Paul's playing of the Three Maries, the second harmonic is the elephant in the room, until we get into the second octave. It's always as big or bigger than the fundamental, and it contributes most of the reediness. The third harmonic is of significance on the very low notes, but loses significance as we get up into the left hand notes. "What we cannot measure..."I'm reminded of Lord Kelvin's "What we cannot measure, we do not know". So much urban myth gets trotted out in place of someone actually bothering to look. So many books on musical instruments tell us that the flute produces a pure and simple tone. They hadn't heard Paul. And they hadn't read Nicholson. And clearly they'd never thought to look at the pure and simple tone on the oscilloscope! I did ...
ConclusionSo what have we learnt from this close encounter with Paul, FFT and a little detective work? Quite a bit I think:
Where to from here?I think probably next I should start to apply some of the ideas discussed above to flutes around me, starting at those most different from each other, as we test the notions further. |
||
AcknowledgementsThe late Paul Davies, for leaving us such a perfect example of his playing to feed this primary investigation. And thanks to the community that has built Audacity and made it
freely available to our community. |


